A bearish Visa (V) stock forecast heading into 2035 depends heavily on your time horizon. Current technical indicators paint a concerning short-term picture””22 indicators signal bearish momentum versus only 4 bullish signals, and the Fear & Greed Index sits at 39, firmly in “Fear” territory. However, long-term projections tell a different story entirely, with 2035 price forecasts averaging $596.51, representing an approximate 81.70% gain from current levels around $328.30.
This disconnect between short-term bearish technicals and long-term bullish projections creates a confusing landscape for investors trying to position themselves for the next decade. For example, an investor who panics at today’s “Strong Sell” rating from StockScan””which shows 13 sell signals against just 2 buy signals””might exit a position that analysts believe will nearly double by 2035. Understanding what these conflicting signals actually mean requires separating technical noise from fundamental trajectory. This article examines the bearish case for Visa stock, explores what current technical weakness suggests about entry timing, analyzes Wall Street’s contradictory bullish consensus, and offers perspective on how long-term investors should interpret today’s fear-driven signals when planning for 2035 and beyond.
Table of Contents
- Why Are Bearish Signals Dominating Visa Stock Right Now?
- What Does a “Strong Sell” Rating Really Mean for Long-Term Holders?
- How Wall Street’s Bullish Consensus Contradicts Technical Weakness
- Evaluating Visa’s Risk Factors Through 2035
- Why Long-Term Forecasts Like 2035 Carry Extreme Uncertainty
- Timing Entry Points During Bearish Technical Periods
- What the 2035 Visa Outlook Means for Portfolio Strategy
- Conclusion
Why Are Bearish Signals Dominating Visa Stock Right Now?
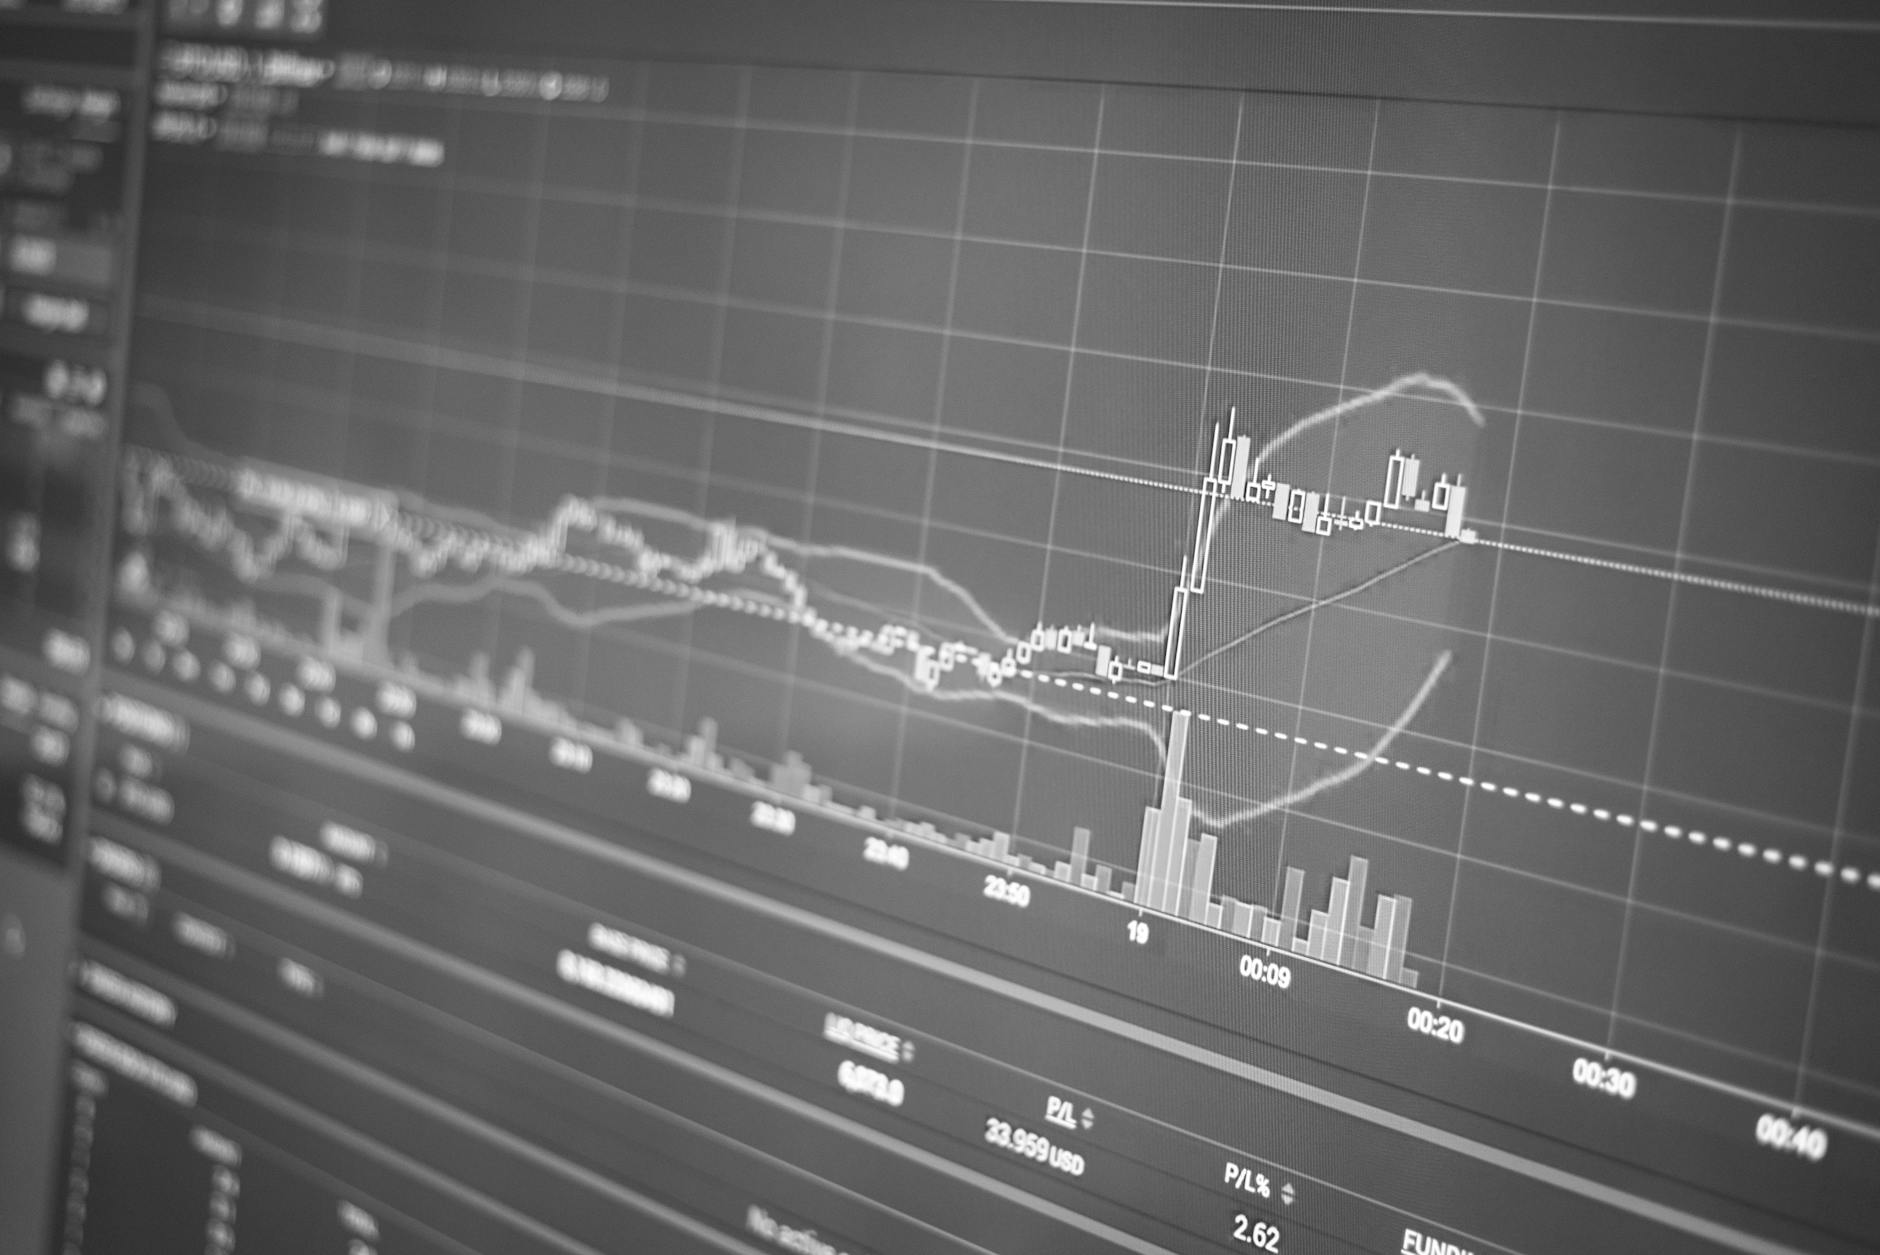
The current bearish technical setup for Visa stems from short-term momentum indicators reacting to recent price action rather than any fundamental deterioration in the company’s business model. When 22 out of 26 technical indicators flash bearish while only 4 remain bullish, it typically reflects a stock experiencing selling pressure, consolidation after gains, or sector-wide rotation rather than company-specific problems. Technical indicators by design respond to price movements over days, weeks, or months. They capture trader sentiment and momentum””not the underlying health of a payments network processing trillions of dollars annually. Compare this to a retailer seeing declining foot traffic or a manufacturer losing market share; those are fundamental concerns.
Visa’s bearish technicals instead reflect market mechanics: profit-taking, macroeconomic fears, or simply the stock catching its breath after extended runs. The Fear & Greed Index reading of 39 adds context. When fear dominates markets broadly, even fundamentally strong companies experience technical deterioration. Investors sell quality names to raise cash or reduce exposure, creating bearish signals that have little to do with 2035 earnings potential. However, investors should note that if these bearish signals persist for months rather than weeks, it may indicate something more concerning than typical consolidation.
What Does a “Strong Sell” Rating Really Mean for Long-Term Holders?
StockScan’s “Strong Sell” designation””driven by 13 sell signals, 2 buy signals, and 2 neutral signals””sounds alarming but requires proper interpretation. These ratings aggregate technical indicators designed for traders with weeks-long holding periods, not investors planning to hold until 2035. The rating suggests short-term price weakness, not that Visa will fail as a business over the next decade. The limitation here is significant: technical ratings excel at timing near-term entries and exits but offer virtually no predictive power over ten-year horizons.
A stock can flash “Strong Sell” technically while simultaneously being undervalued fundamentally. In fact, some of the best long-term entry points occur precisely when technical indicators look worst””when fear has pushed prices below intrinsic value. However, if you need the capital within the next year, these bearish signals matter considerably. The same short-term weakness that represents opportunity for decade-long investors creates real risk for those with imminent liquidity needs. Investors expecting to access Visa holdings before 2030 should weight current technical deterioration more heavily than those genuinely planning to hold through 2035.
How Wall Street’s Bullish Consensus Contradicts Technical Weakness
While technical indicators scream caution, Wall Street analysts maintain overwhelming optimism. The consensus rating stands at “Strong Buy” with 20 buy recommendations, 3 holds, and zero sells across 23 covering analysts. Their average 12-month price target of $402.90 implies roughly 23% upside from current levels, with forecasts ranging from $330.00 to $450.00. this divergence between analyst optimism and technical pessimism illustrates how different methodologies examine different questions. Analysts evaluate Visa’s competitive position, revenue growth, margin trajectory, and strategic initiatives.
They see a payments duopoly with massive network effects, recurring revenue, and secular tailwinds from cash-to-digital conversion globally. Technicians, conversely, see a chart under pressure regardless of why. For 2035 forecasting specifically, analyst fundamentals matter more than current technicals. The projected average price of $596.51 by 2035 (with estimates ranging from $570.30 to $596.91) reflects expectations for continued earnings growth compounding over a decade. While these long-term forecasts carry substantial uncertainty””no one accurately predicts stock prices ten years out””they’re grounded in business analysis rather than short-term price patterns.

Evaluating Visa’s Risk Factors Through 2035
Any honest 2035 forecast must acknowledge the risks that could validate a truly bearish long-term thesis. Visa faces genuine threats: regulatory pressure on interchange fees, potential antitrust action, central bank digital currencies that could disintermediate card networks, and emerging payment technologies that might bypass traditional rails entirely. Consider the regulatory example: if major economies cap interchange fees significantly below current levels, Visa’s revenue model suffers structural impairment. This isn’t a technical indicator””it’s a fundamental risk that could make current $596 price targets obsolete.
Similarly, if China’s UnionPay or emerging blockchain payment networks capture substantial global share, Visa’s growth trajectory changes materially. The tradeoff investors face is classic: Visa’s dominant market position and proven business model offer relative safety, while disruption risks create tail scenarios where even conservative forecasts prove optimistic. For context, Visa has navigated previous disruption fears””mobile payments, cryptocurrency enthusiasm, fintech competition””while maintaining growth. Past resilience doesn’t guarantee future success, but it suggests adaptability.
Why Long-Term Forecasts Like 2035 Carry Extreme Uncertainty
Long-term stock price predictions deserve substantial skepticism. The 2035 forecasts projecting Visa near $600 assume relatively consistent growth, stable competitive dynamics, and no major structural disruptions””assumptions that frequently fail over decade-long periods. These projections extrapolate current trends forward, which works until it doesn’t. The range between the low estimate ($570.30) and high estimate ($596.91) for 2035 appears deceptively narrow. Real outcomes over ten-year periods show far wider dispersion.
Unforeseen events””recessions, technological disruption, regulatory changes, management missteps””create variance that no algorithm captures. Any 2035 forecast should be treated as a directional indicator rather than a target. Investors should also recognize survivorship bias in forecasting models. They’re calibrated on companies that succeeded; those that failed or declined significantly aren’t training the algorithms predicting your returns. Visa will likely remain a relevant company in 2035, but whether it achieves an 81.70% return depends on countless variables no current model can reliably predict.

Timing Entry Points During Bearish Technical Periods
Current bearish signals, while not predictive of 2035 outcomes, may offer practical value for entry timing. If you’ve decided Visa deserves a place in your long-term portfolio, buying during periods of technical weakness and elevated fear often produces better outcomes than buying during euphoric rallies.
For example, an investor adding to Visa positions during the current “Strong Sell” technical setup might achieve a lower average cost basis than one waiting for bullish confirmation. Dollar-cost averaging through periods of fear historically benefits long-term compounding, even when individual purchases seem ill-timed in the moment.
What the 2035 Visa Outlook Means for Portfolio Strategy
For investors building portfolios intended to compound through 2035 and beyond, current bearish signals represent noise rather than signal. The more relevant questions concern Visa’s fundamental position: can the payments network maintain pricing power, continue taking share from cash, and defend against emerging competitors? Wall Street’s 23 analysts answering “yes” with zero sell ratings provides one data point, though investors should form independent views. The appropriate response to today’s fear-driven technical weakness depends entirely on your circumstances.
Long-term investors with excess capital might view current levels as attractive entry points. Those fully allocated or facing near-term liquidity needs should respect the short-term caution these indicators suggest. The 2035 forecast of $596.51 represents potential, not promise””and the path there will almost certainly include further periods of bearish signals, drawdowns, and fear.
Conclusion
The bearish V stock forecast debate ultimately reveals more about forecasting limitations than about Visa’s actual prospects. Current technical indicators showing 22 bearish signals, a Fear & Greed reading of 39, and a “Strong Sell” rating describe short-term market psychology. They don’t capture whether Visa will process more transactions in 2035 or maintain its competitive moat against emerging payment technologies.
For investors focused on 2035, the more relevant data points are Wall Street’s unanimous bullish consensus, the structural tailwinds favoring digital payments globally, and Visa’s demonstrated ability to navigate competitive threats over decades. The projected 81.70% gain to approximately $596.51 represents a reasonable base case but not a guarantee. Treat today’s bearish technicals as potential entry opportunity rather than warning, while maintaining appropriate position sizing for the genuine long-term risks that no forecast adequately captures. As always, long-term stock forecasts remain highly speculative, and this analysis should not be construed as investment advice.